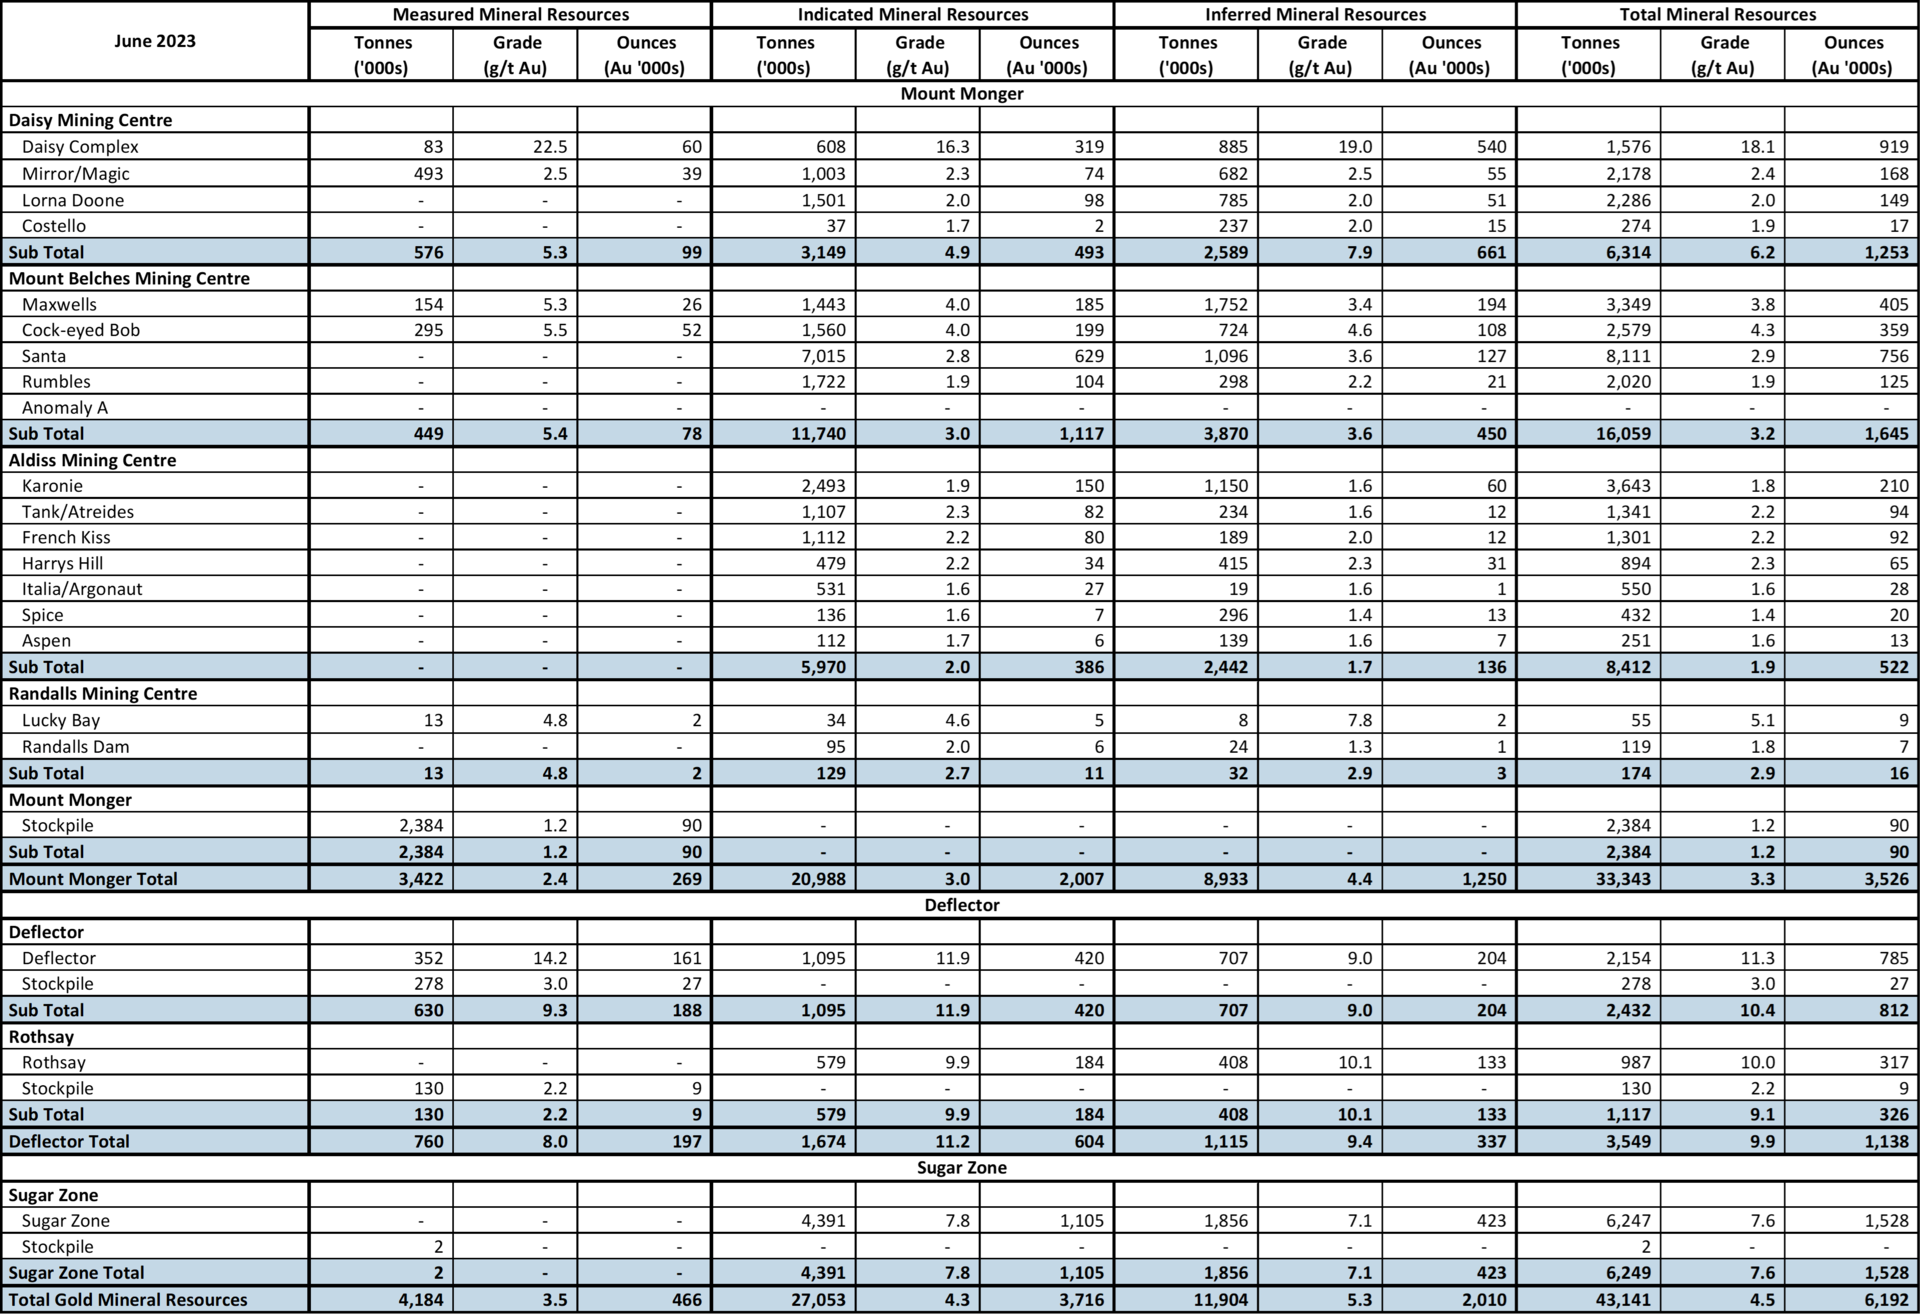
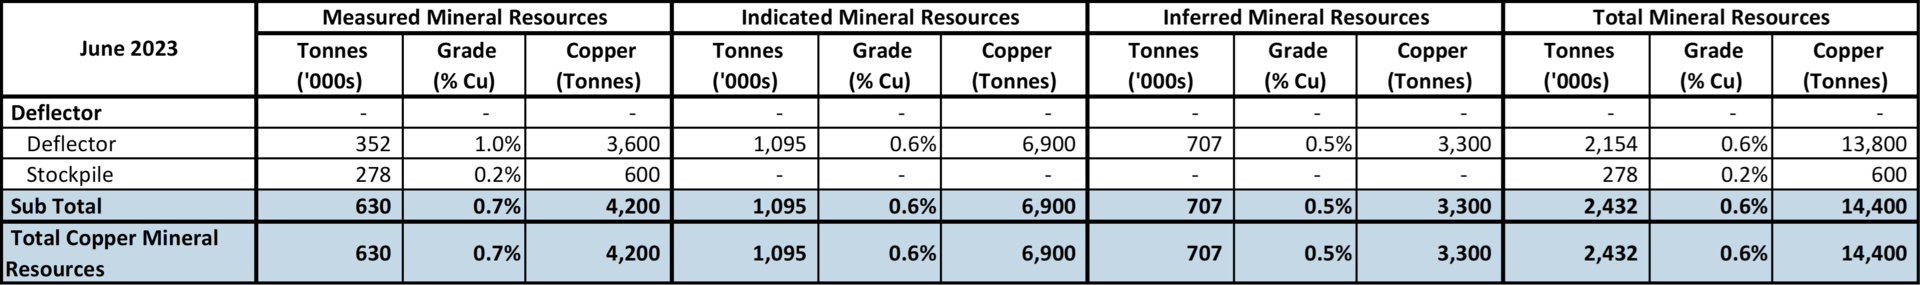
MINERAL RESOURCE STATEMENT AS AT 30 JUNE 2023
The Company’s total Measured, Indicated and Inferred Mineral Resources at 30 June 2023 are 43.1 million tonnes at 4.5 grams per tonne of gold containing 6.2 million ounces of gold, including 2.4 million tonnes at 0.6 percent copper containing 14,400 tonnes of copper. The Mineral Resources as at 30 June 2023 are estimated after allowing for depletion during FY2023
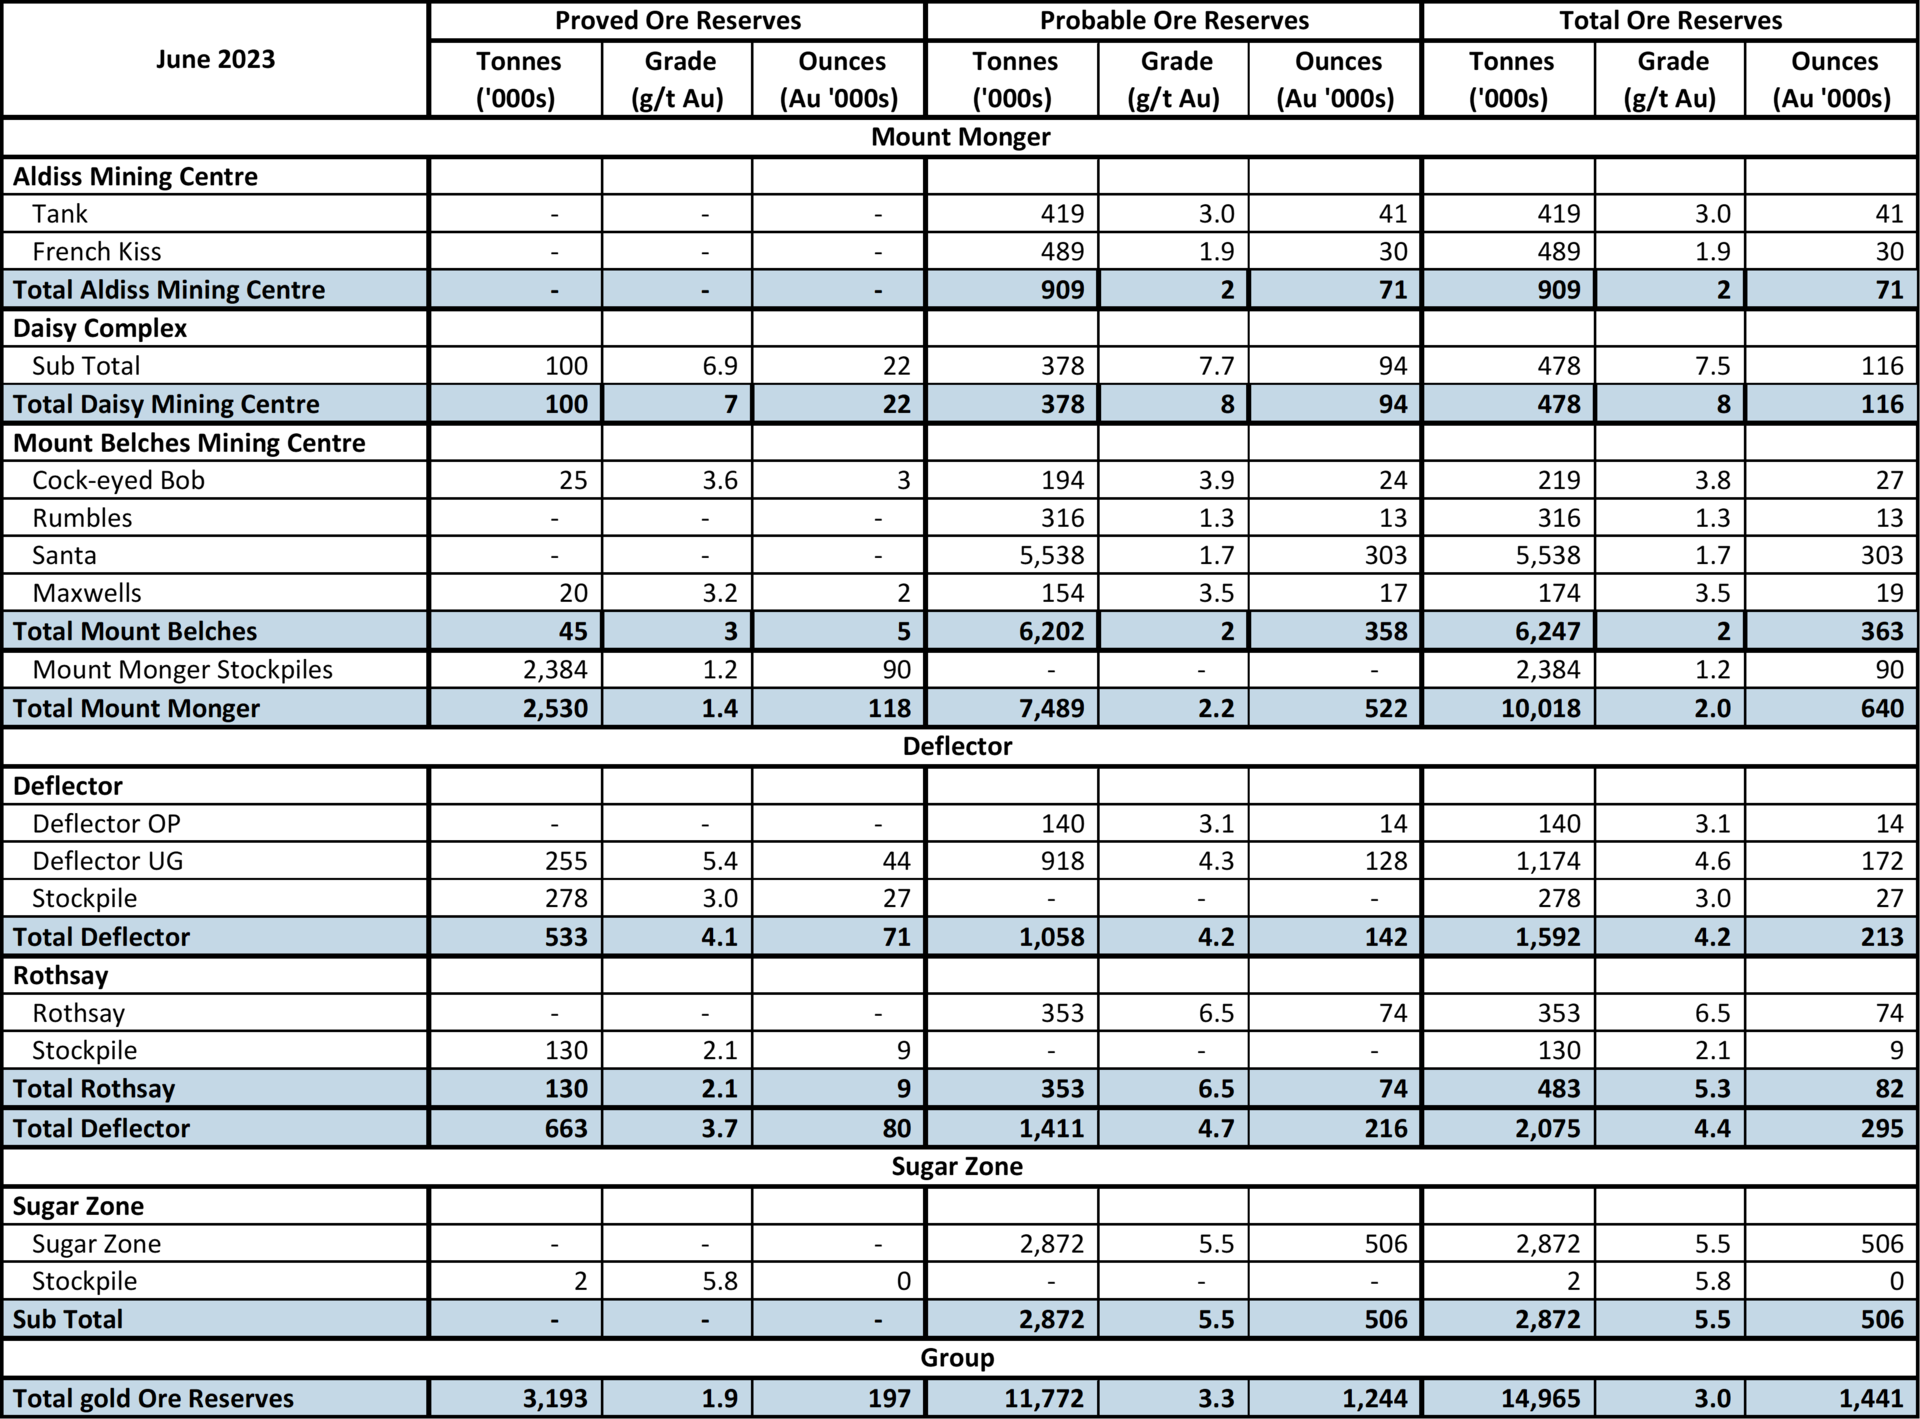
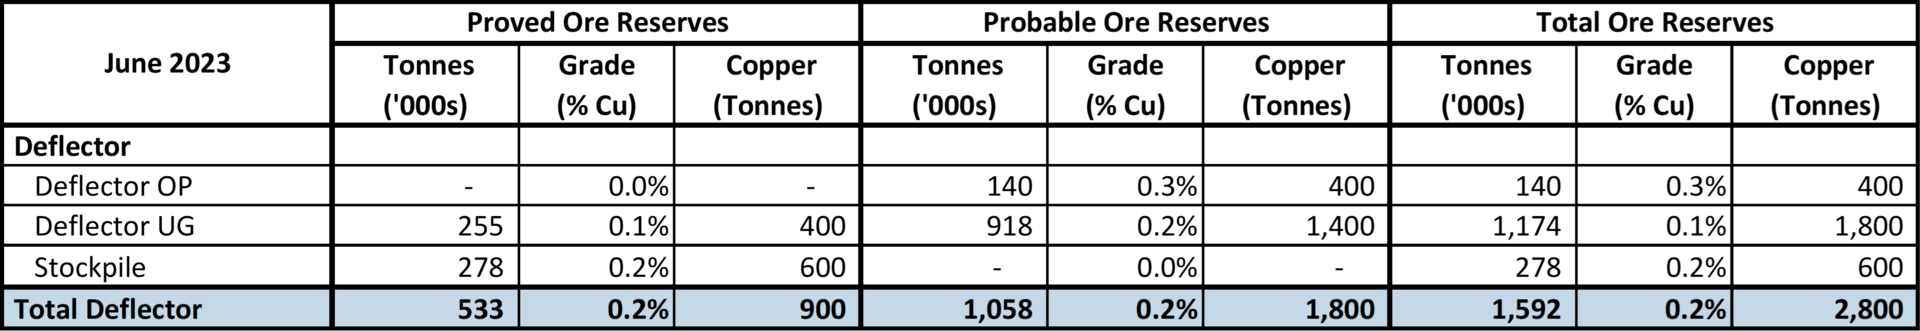
ORE RESERVE STATEMENT AS AT 30 JUNE 2023
The
total Proved and Probable Ore Reserves at 30 June 2023 are 14.9 million tonnes
at 3.0 g/t gold containing 1.44 million ounces of gold, including 1.6 million
tonnes at 0.2 % Cu containing 2,800 tonnes of copper. The Ore Reserves at 30
June 2023 are estimated after allowing for depletion over FY2023. Mount Monger Ore Reserves were estimated
using a gold price of A$2,200/oz for Tank South, Santa Underground and Flora
Dora, A$2,300/oz for Maxwells, A$2,400/oz for Daisy Complex and Cock-eyed Bob,
A$2,600/oz for Santa Open Pit and A$2,800/oz for Rumbles. Sugar Zone Ore
Reserves were estimated using C$2,300/oz. Deflector Ore Reserve NSR was
estimated using A$2,400/oz gold price and A$11,900/t copper price.
Notes to Tables Mineral Resource and Ore Reserve tables:
1. Mineral
Resources are reported inclusive of Ore Reserves.
2.
Data is rounded to thousands of tonnes, thousands of ounces
gold, and hundreds of tonnes copper. Discrepancies in totals may occur due to
rounding.
3.
All Mineral Resource and Ore Reserve estimates are produced in
accordance with the 2012 Edition of the Australian Code for Reporting of
Mineral Resources and Ore Reserves (the 2012 JORC Code).
4.
The Table 1 Checklists of Assessment and Reporting Criteria
relating to the updated 2012 JORC Code Mineral Resources and Ore Reserves
estimates for significant projects that are reported for the first time or when
those estimates have materially changed are contained in the Appendix to this
announcement.
MINERAL RESOURCE AND ORE RESERVE GOVERNANCE AND INTERNAL CONTROLS
Silver Lake ensures that the Mineral Resource and Ore
Reserve estimates quoted are subject to governance arrangements and internal
controls activated at a site level and at the corporate level. Internal reviews
of Mineral Resource and Ore Reserve estimation procedures and results are
carried out through a technical review team which is comprised of highly
competent and qualified professionals. These reviews have not identified any
material issues. The Company has finalised its governance framework in relation
to the Mineral Resource and Ore Reserve estimates in line with the conduct of
its business. Silver Lake reports its Mineral Resources and Ore Reserves on an
annual basis in accordance with the ‘Australasian Code for Reporting of
Exploration Results, Mineral Resources and Ore Reserves’ (the JORC Code) 2012
Edition (except where stated). Mineral Resources are quoted inclusive of Ore
Reserves. Competent Persons named by Silver Lake are Members or Fellows of the
Australasian Institute of Mining and Metallurgy and/or the Australian Institute
of Geoscientists and qualify as Competent Persons as defined in the JORC Code.
The Mineral Resources and Ore Reserves statements are based upon, and fairly
represent, information and supporting documentation prepared by the Competent
Persons named below. The Mineral Resources statement as a whole, as presented
in this Annual Report, has been approved by Antony Shepherd a Competent Person
who is a member of The Australasian Institute of Mining and Metallurgy. The Ore
Reserves statement as a whole, as presented in this Annual Report, has been
approved by Sam Larritt a Competent Person who is a member of The Australasian
Institute of Mining and Metallurgy.
COMPETENT PERSON'S STATEMENT
The information in this Annual Report that relates to the
Mineral Resources for the Harrys Hill, Santa, Cock-eyed Bob, Maxwells, Daisy
Combined, Mirror/Magic, Tank/Atreides, Spice, Aspen, French Kiss,
Italia/Argonaut, Lorna Doone, Rumbles, Costello, Randalls Dam and Karonie
deposits is based upon information compiled by Aslam Awan, a Competent Person
who is a member of The Australasian Institute of Mining and Metallurgy. Mr Awan
is a full-time employee of the Company. Mr Awan has sufficient experience that is
relevant to the style of mineralisation and type of deposit under consideration
and to the activity being undertaken to qualify as a Competent Person as
defined in the 2012 Edition of the ‘Australasian Code for Reporting of
Exploration Results, Mineral Resources and Ore Reserves’. Mr Awan consents to
the inclusion in the Annual Report of matters based on his information in the
form and context in which it appears. The information in this Annual Report that
relates to the Mineral Resources for the Deflector deposit is based upon
information compiled by David Buckley, a Competent Person who is a member of
The Australasian Institute of Mining and Metallurgy. Mr Buckley is a full-time
employee of the Company. Mr Buckley has sufficient experience that is relevant
to the style of mineralisation and type of deposit under consideration and to
the activity being undertaken to qualify as a Competent Person as defined in
the 2012 Edition of the ‘Australasian Code for Reporting of Exploration
Results, Mineral Resources and Ore Reserves’. Mr Buckley consents to the
inclusion in the Annual Report of matters based on his information in the form
and context in which it appears. The information in this Annual Report that
relates to the Mineral Resources for the Rothsay and Sugar Zone deposits is
based upon information compiled by Kane Hutchinson, a Competent Person who is a
member of The Australasian Institute of Mining and Metallurgy. Mr Hutchinson is
a full-time employee of the Company. Mr Hutchinson has sufficient experience
that is relevant to the style of mineralisation and type of deposit under
consideration and to the activity being undertaken to qualify as a Competent
Person as defined in the 2012 Edition of the ‘Australasian Code for Reporting
of Exploration Results, Mineral Resources and Ore Reserves’. Mr Hutchinson consents
to the inclusion in the Annual Report of matters based on his information in
the form and context in which it appears. The information in this Annual Report
that relates to Ore Reserves for Deflector, Daisy, Maxwells, Cock-eyed Bob,
Santa, Rumbles, Tank and French Kiss is based upon information compiled by Sam
Larritt, a Competent Person who is a member of The Australasian Institute of
Mining and Metallurgy. Mr Larritt is a full-time employee of the Company. Mr
Larritt has sufficient experience that is relevant to the style of
mineralisation and type of deposit under consideration and to the activity
being undertaken to qualify as a Competent Person as defined in the 2012
Edition of the ‘Australasian Code for Reporting of Exploration Results, Mineral
Resources and Ore Reserves’. Mr Larritt consents to the inclusion in the Annual
Report of matters based on his information in the form and context in which it
appears. The information in this Annual Report that relates to Ore Reserves for
Rothsay and Sugar Zone is based upon information compiled by Jigar Patel, a
Competent Person who is a member of The Australasian Institute of Mining and
Metallurgy. Mr Patel is a full-time employee of the Company. Mr Patel has
sufficient experience that is relevant to the style of mineralisation and type
of deposit under consideration and to the activity being undertaken to qualify
as a Competent Person as defined in the 2012 Edition of the ‘Australasian Code
for Reporting of Exploration Results, Mineral Resources and Ore Reserves’. Mr
Patel consents to the inclusion in the Annual Report of matters based on his
information in the form and context in which it appears. All other information
in this Annual Report relating to Mineral Resources is based on information
compiled by Antony Shepherd, a Competent Person who is a member of The
Australasian Institute of Mining and Metallurgy. Mr Shepherd is employed by
Silver Lake Resources. Mr Shepherd has sufficient experience that is relevant
to the style of mineralisation and type of deposit under consideration and to
the activity being undertaken to qualify as a Competent Person as defined in
the 2012 Edition of the ‘Australasian Code for Reporting of Exploration
Results, Mineral Resources and Ore Reserves’. Mr Shepherd consents to the
inclusion in the Annual Report of matters based on his information in the form
and context in which it appears.
FORWARD LOOKING STATEMENTS
This Annual Report may contain forward looking statements
that are subject to risk factors associated with gold exploration, mining, and
production businesses. It is believed that the expectations reflected in these
statements are reasonable but they may be affected by a variety of variables
and changes in underlying assumptions which could cause actual results or
trends to differ materially, including but not limited to price fluctuations,
actual demand, currency fluctuations, drilling and production results, Reserve
estimations, loss of market, industry competition, environmental risks,
physical risks, legislative, fiscal and regulatory changes, economic and
financial market conditions in various countries and regions, political risks,
project delay or advancement, approvals and cost estimates. Forward-looking
statements, including projections, forecasts and estimates, are provided as a
general guide only and should not be relied on as an indication or guarantee of
future performance and involve known and unknown risks, uncertainties and other
factors, many of which are outside the control of Silver Lake. Past performance
is not necessarily a guide to future performance and no representation or
warranty is made as to the likelihood of achievement or reasonableness of any
forward looking statements or other forecast.